Direkte målinger af CO2 i atmosfæren før 1960
| Direkte målinger af CO2 i atmosfæren før 196028-03-2012 12:20 | |
| Frank Lansner★★★★★ (5727) |
Hej alle! Her lige et udsnit fra en artikel der snart kommer påHidethedecline/ Joanne Novas. Jeg håber i kan leve med at det er på Engelsk, i skal selvsagt ikke svare på Engelsk. ******************************** 5) CO2 data Was it correct to move the CO2 data from the Siple ice core 83 years (from 1890 to 1973) to stich them with the Mauna Loa data? Vindmøller er IN!! Vedvarende energi er IN!!! Men vi må aldrig ofre åben og sund videnskab - heller ikke når det gælder klima. Tilknyttet billede: 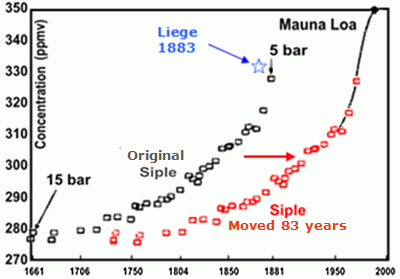 |
| 28-03-2012 12:20 | |
| Frank Lansner★★★★★ (5727) |
Fig 5.1 The argument is that ice far below surface still has contact with surface air, and thus, the airborne CO2 reaches 83 year old ice. Howcome 83 year old ice takes up CO2 from today but not for example airborne sulphates? - In fact, at a depth of about 50 m of the D-57 Antarctic ice core, Raynaud and Barnola (1985) found sulphur deposition from the Tambora (Indonesia) volcanic explosion in 1815. Thus, at 50 meters depth you find air from 1815, but at 70 m we should find air from 1973? (see: http://www.greenworldtrust.org.uk/Science/Scientific/CO2-ice-HS.htm ) Vindmøller er IN!! Vedvarende energi er IN!!! Men vi må aldrig ofre åben og sund videnskab - heller ikke når det gælder klima. Tilknyttet billede: 
Redigeret d. 28-03-2012 12:33 |
| 28-03-2012 12:22 | |
| Frank Lansner★★★★★ (5727) |
Fig 5.2 However, after dialog with a Danish scientist Anders Svensson from the Niels Bohr institute, I find it possible, that the more reactive substances like sulphates, HCL, NO3 etc will have reacted before being able to enter deeper ice layers while CO2 in some form can actually survive the journey down to 70 m depth of old snowy ice. However, such CO2 data should be handled with some caution? Vindmøller er IN!! Vedvarende energi er IN!!! Men vi må aldrig ofre åben og sund videnskab - heller ikke når det gælder klima. Tilknyttet billede: 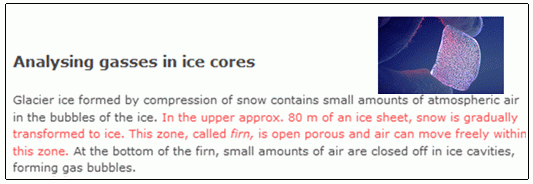 |
| 28-03-2012 12:23 | |
| Frank Lansner★★★★★ (5727) |
From the Niels Bohr institute: http://www.iceandclimate.nbi.ku.dk/research/drill_analysing/cutting_and_analysing_ice_cores/analysing_gasses/ What strikes me is that one operates with a general idea that the "snowy" firn reaches around 80 m down. So at least, the idea that CO2 was to be moved around 80-90 years appears possible. But then again Schwander et al. 1997 conclude that the air in ice caps has to be moved 210 years, not 83 years, and thus things appears a little cloudy still. On Fig 5.1 I show a blue star named "Liege". This represent a high quality sample of background CO2 data taken 1883 shown in fine detail by the late Ernst Georg Beck. I will get back to the Liege data. Vindmøller er IN!! Vedvarende energi er IN!!! Men vi må aldrig ofre åben og sund videnskab - heller ikke når det gælder klima. Tilknyttet billede: 
Redigeret d. 28-03-2012 12:34 |
| 28-03-2012 12:23 | |
| Frank Lansner★★★★★ (5727) |
Fig 5.3 Random vs. actual. One of the above graphics shows historic CO2 results where measurement years have been made random within the interval 1900-1961. The other graphic shows CO2 results plotted with actual measurement years. Does one of the above plots show a trend less likely to be a random pile of error data? In the above plots, the CO2 results above are shown for those CO2 datasets that Beck was able to adjust (The ones with known seasonal timing etc.). Howcome these "odd" CO2 results in fact appears to be not just (random) errors ? If the different CO2 results was in fact just freak errors, how would you explain that these error form a clear "error-trend"? Lets take a look at some of these results and evaluate for our selves the real quality we are dealing with here. I had the honour of being in mail dialog with E.G.Beck in his last years, and he explained with great passion some new data he was analysing, CO2 data from a US Forest, and let me explain why he was excited: Vindmøller er IN!! Vedvarende energi er IN!!! Men vi må aldrig ofre åben og sund videnskab - heller ikke når det gælder klima. Tilknyttet billede:  |
| 28-03-2012 12:24 | |
| Frank Lansner★★★★★ (5727) |
Fig 5.4 When measuring CO2 the issue is to pinpoint the "background level" of CO2. During the day and during the year CO2 levels oscillates. The daily oscillation near the surface normally has a larger amplitude than the yearly changes due to the shifting biosphere activity. However these large daily oscillation occurs mostly near the surface. In other words, in higher altitude we get a better idea of the "background" level of CO2 that does not oscillate that much. On the surface, it so happens, that the faster winds we have, the better constant mixing and refreshing of air, that is, during windy days our CO2 level even at the surface wil come closer to the background level. For the Harvard Forest data, we see surface measurements combined with wind data yield a background CO2 estimate of 373 ppm for the period 1992-2007. In that period Mauna Loa shows an average of 369 ppm CO2, and the wind method appears useful. I guess that's why Beck was excited. Vindmøller er IN!! Vedvarende energi er IN!!! Men vi må aldrig ofre åben og sund videnskab - heller ikke når det gælder klima. Tilknyttet billede: 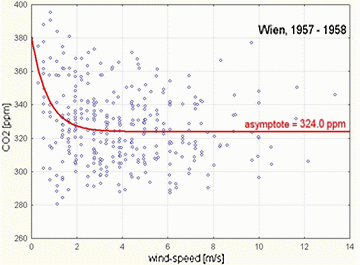 |
| 28-03-2012 12:26 | |
| Frank Lansner★★★★★ (5727) |
Fig 5.5 For Vienna, Beck found a background CO2 level of 324 ppm using the wind approach for the years 1957-58. Mauna Loa says 318 ppm. Vindmøller er IN!! Vedvarende energi er IN!!! Men vi må aldrig ofre åben og sund videnskab - heller ikke når det gælder klima. Tilknyttet billede: 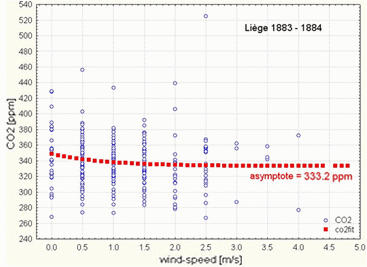
Redigeret d. 28-03-2012 12:26 |
| 28-03-2012 12:27 | |
| Frank Lansner★★★★★ (5727) |
Fig 5.6 And Beck finds 372 ppm outside Giessen in central Germany, for the years 1939 and 1940. Obviously the most direct way to get the background CO2 level is to have data from higher altitudes. Vindmøller er IN!! Vedvarende energi er IN!!! Men vi må aldrig ofre åben og sund videnskab - heller ikke når det gælder klima. Tilknyttet billede: 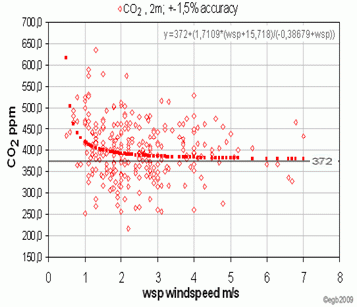 |
| 28-03-2012 12:28 | |
| Frank Lansner★★★★★ (5727) |
Fig 5.7 And "Beck" finds 372 ppm outside Giessen in central Germany, for the years 1939 and 1940. Obviously the most direct way to get the background CO2 level is to have data from higher altitudes. Vindmøller er IN!! Vedvarende energi er IN!!! Men vi må aldrig ofre åben og sund videnskab - heller ikke når det gælder klima. Tilknyttet billede: 
Redigeret d. 28-03-2012 12:33 |
| 28-03-2012 12:31 | |
| Frank Lansner★★★★★ (5727) |
Fig 5.8 Beck has analysed different datasets for CO2 in higher altitude, and it seems that altitudes over 500 m begins to show a stable background CO2 level – at least in these datasets. Surgut in 1996 showed a background level this way of arounf 368 ppm, while Mauna Loa showed 363 ppm. Likewise, Helsinki data over 500 m stabilizes at a background level on around 360 ppm in 1935. In all the examples of data shown for different winds, the resulting background CO2 level occurs approximately in the middle of the bulk of all data point. And normally there are a few "freak values" or "outlier" data points within the datasets. Vindmøller er IN!! Vedvarende energi er IN!!! Men vi må aldrig ofre åben og sund videnskab - heller ikke når det gælder klima. Tilknyttet billede: 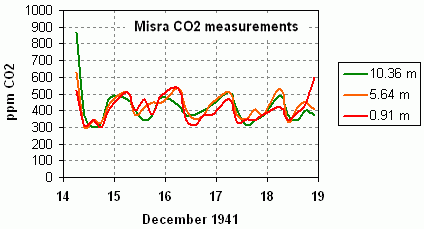 |
| 28-03-2012 12:31 | |
| Frank Lansner★★★★★ (5727) |
Fig 5.9 For Misra (India) the bulk of data points oscillates between 300 and 500 ppm CO2 which would perhaps suggest a bacground level not too far from 400 ppm. In Beck´s revised graph he sets 1941 to around 380 ppm CO2 though.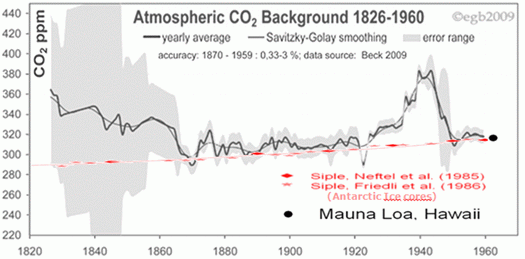 Vindmøller er IN!! Vedvarende energi er IN!!! Men vi må aldrig ofre åben og sund videnskab - heller ikke når det gælder klima. |
| 28-03-2012 12:32 | |
| Frank Lansner★★★★★ (5727) |
Fig 5.10 After this little intro to Becks CO2 data, I can show the best estimate for CO2 levels according to Beck. I have compared with the Siple data after it was moved 83 years, red graph. Note: "CO2 is very responsive to temperature changes 1979-2008. So how come the warmer temperatures 1920-40´s has no effect at all on the extremely flat Antarctic CO2 curve?" See: http://wattsupwiththat.com/2008/12/17/the-co2-temperature-link/ Schwander et al. 1997: http://www.climate.unibe.ch/~jasch/publications/schwander97.PDF Fischer et al. 1998: http://epic.awi.de/823/1/Fis1998b.pdf Beck 2009 on CO2-wind relations: http://www.biokurs.de/treibhaus/CO2_versus_windspeed-review-1-FM.pdf Warwick Hughes on the CO2 data changes: http://www.warwickhughes.com/icecore/zjmar07.pdf Vindmøller er IN!! Vedvarende energi er IN!!! Men vi må aldrig ofre åben og sund videnskab - heller ikke når det gælder klima. Redigeret d. 28-03-2012 12:35 |
Deltag aktivt i debatten Direkte målinger af CO2 i atmosfæren før 1960:
Lignende indhold
| Debatter | Svar | Seneste indlæg |
| Direkte målinger af CO2s effekt i atmosfæren | 59 | 29-09-2022 21:08 |
| Er der for lidt CO2 i atmosfæren? | 15 | 23-09-2022 20:54 |
| Udviklingen i vandstanden i Østersøen - tidevands- og satellite målinger | 0 | 08-11-2019 18:04 |
| Farligt når fokus ligger på CO2 indhold i atmosfæren.... | 1 | 07-05-2018 16:21 |
| PH-målinger af vores vand. | 30 | 08-11-2017 16:58 |
| Artikler |
| Atmosfære |
| Atmosfæren (Bionyt: 500 svar om klima) |
| Nyheder | Dato |
| Flere orkaner skyldes flere målinger | 21-06-2011 12:54 |
| Varme i Arktis gav mere metan i atmosfæren | 29-09-2009 06:50 |
| Mere metan i atmosfæren | 20-03-2009 09:04 |
| Allerede farligt meget CO2 i atmosfæren | 10-11-2008 09:28 |
| Støvsug CO2 ud af atmosfæren | 17-10-2008 07:58 |