Udviklingen i vandstanden i Østersøen - tidevands- og satellite målinger
| Udviklingen i vandstanden i Østersøen - tidevands- og satellite målinger08-11-2019 18:04 | |
| kfl★★★★★ (2167) |
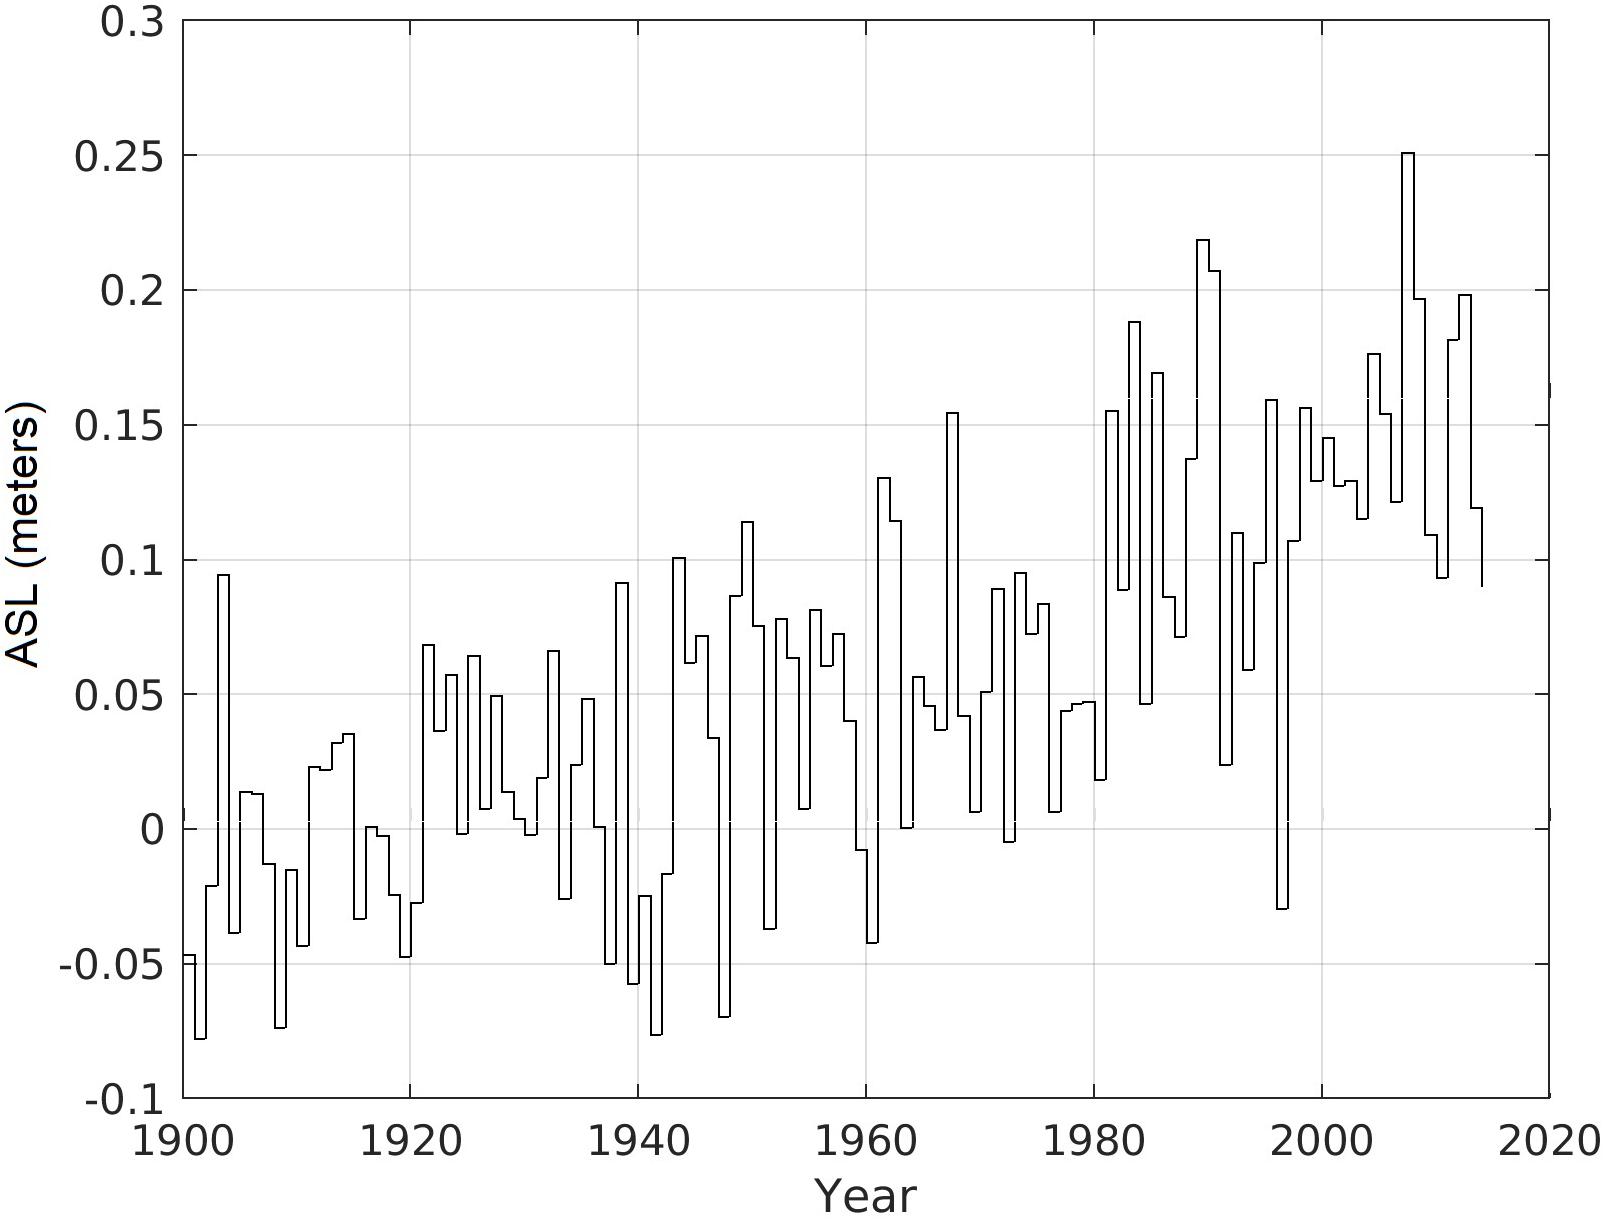
Sea Level Trends and Variability of the Baltic Sea From 2D Statistical Reconstruction and Altimetry Kristine S. Madsen1*, Jacob L. Høyer1, Ülo Suursaar2, Jun She1 and Per Knudsen1 1:Danish Meteorological Institute, Copenhagen, Denmark, 2:Estonian Marine Institute, University of Tartu, Tallinn, Estonia 3:DTU Space, Lyngby, Denmark3 2D sea level trend and variability fields of the Baltic Sea were reconstructed based on statistical modeling of monthly tide gauge observations, and model reanalysis as a reference. The reconstruction included both absolute and relative sea level (RSL) in 11 km resolution over the period 1900–2014. The reconstructed monthly sea level had an average correlation of 96% and root mean square error of 3.8 cm with 56 tide gauges independent of the statistical model. The statistical reconstruction of sea level was based on multiple linear regression and took land deformation information into account. An assessment of the quality of an open ocean altimetry product (ESA Sea Level CCI ECV, hereafter "the CCI") in this regional sea was performed by validating the variability against the reconstruction as an independent source of sea level information. The validation allowed us to determine how close to the coast the CCI can be considered reliable. The CCI matched reconstructed sea level variability with correlation above 90% and root-mean-square (RMS) difference below 6 cm in the southern and open part of the Baltic Proper. However, areas with seasonal sea ice and areas of high natural variability need special treatment. The reconstructed RSL change, which is important for coastal communities, was found to be dominated by isostatic land movements. This pattern was confirmed by independent observations and the values were provided along the entire coastline of the Baltic Sea. The area averaged absolute sea level change for the Baltic Sea was 1.3 ± 0.3 mm/yr for the 20th century, which was slightly below the global mean for the same period. Considering the relative shortness of the satellite era, natural variability made trend estimation sensitive to the selected data period, but the linear trends derived from the reconstruction (3.4 ± 0.7 mm/yr for 1993–2014) fitted with those of the CCI (4.0 ± 1.4 mm/yr for 1993–2015) and with global mean estimates within the limits of uncertainty. Flot arbejde. De kan noget på DMI. Der er to overraskende resultater af analysen: Den absolutte vandstandsstigning i den 20. århundrede er på 1.3 mm/år Den absolutte vandstandsstigninger i 1993-2015 er på 3.4 mm/år Forklaringen ligger i, at der korrigeres landhævninger. Hoved resultat af den omfattende analyser kan ses her:  Her er en graf, der viser udviklingen i vandstanden i Østersøen bestemt ud fra data fra University of Colerado. Data er et par år gamle og der er korrigeret for landhævninger.    Jeg har været ind på European Environment Agency, der indeholder man interessant statistikker. Spatial distribution of trends in mean sea level in European seas (January 1993- December 2017) Trend in relative sea level at selected European tide gauge stations Det er helt sikker, at disse resultater vil blive afvist hele den skeptisk bande. Jeg sender et link til Frank Lanser og nn KFL Vær skeptisk over for skeptikerne.... Det er der grund til. Redigeret d. 08-11-2019 18:09 |
Deltag aktivt i debatten Udviklingen i vandstanden i Østersøen - tidevands- og satellite målinger:
Lignende indhold
| Debatter | Svar | Seneste indlæg |
| Direkte målinger af CO2s effekt i atmosfæren | 59 | 29-09-2022 21:08 |
| Vandstanden ved Tuvalu... | 34 | 12-05-2021 11:17 |
| Tadea Vengs: Consolidating sea level acceleration estimates from satellite altimetry | 5 | 10-02-2020 01:03 |
| PH-målinger af vores vand. | 30 | 08-11-2017 16:58 |
| Vandstanden i verdenshavene – et paradoks afløser et andet | 82 | 26-01-2015 15:12 |
| Artikler |
| Havniveau |
| Nyheder | Dato |
| Flere orkaner skyldes flere målinger | 21-06-2011 12:54 |
| Varmere klima ikke årsagen til iltsvind i Østersøen | 15-10-2009 12:47 |
| Vandstanden synker i store floder | 23-04-2009 06:08 |